What the walkthrough shows
The sequence follows the simulator from account entry through settings, drink selection, BAC range visualization, keypoint analysis, report export, and saved simulation management.
Why the chart matters
The current simulator updates chart output in real time, making absorption, elimination, range assumptions, peak BAC, and event-time review visible as inputs change.
Where keypoint analysis fits
The keypoint can represent a traffic stop, preflight check, test time, crash, workplace event, or other time where the modeled BAC value matters.
Setup
Start and configure the scenario
Begin from the account simulation list, then define the subject and baseline assumptions that will control the BAC curve.
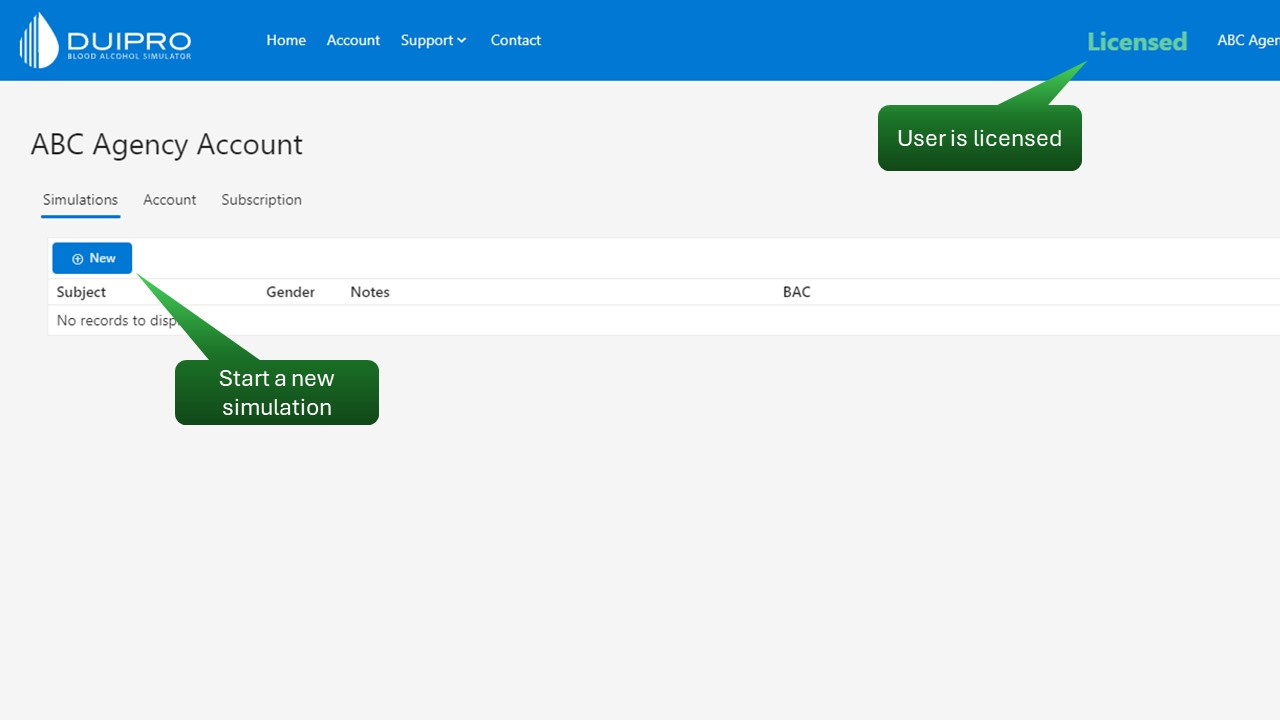
Start a new simulation
The account screen shows the licensed status and the New button used to create a fresh simulation profile.
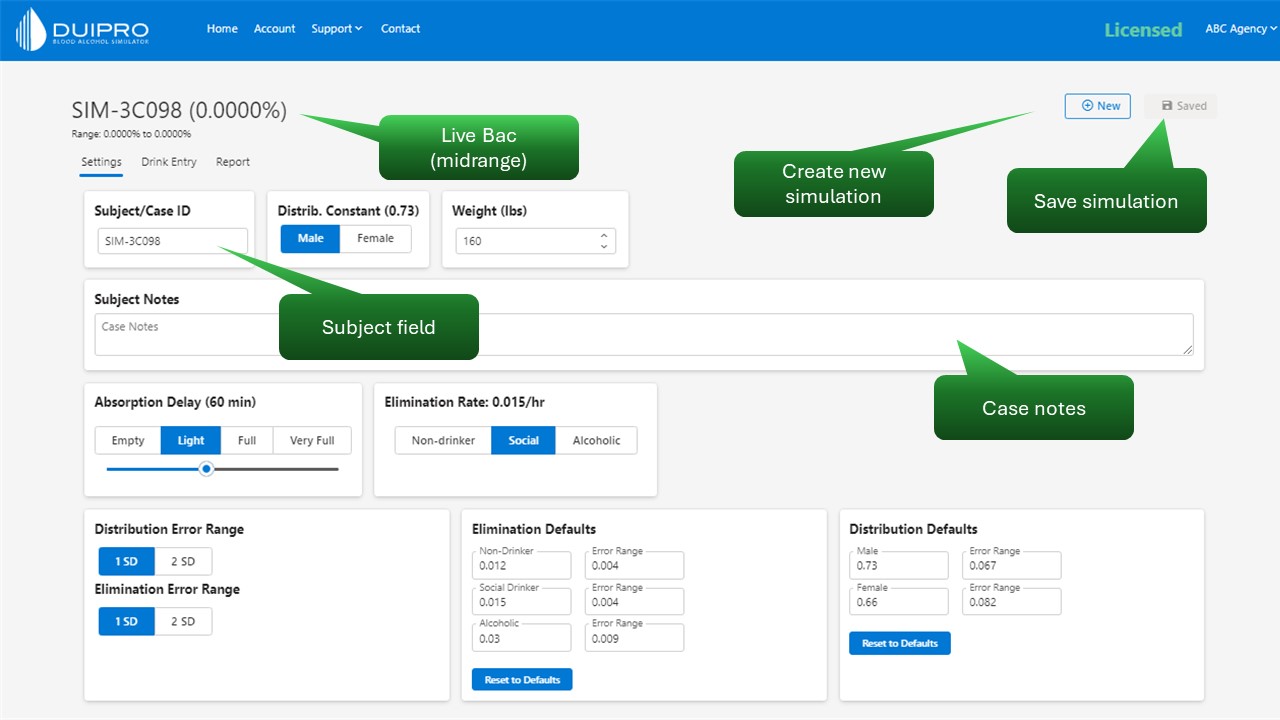
Set subject and calculation variables
The settings tab captures the subject variables and calculation assumptions that drive the later chart and report output.
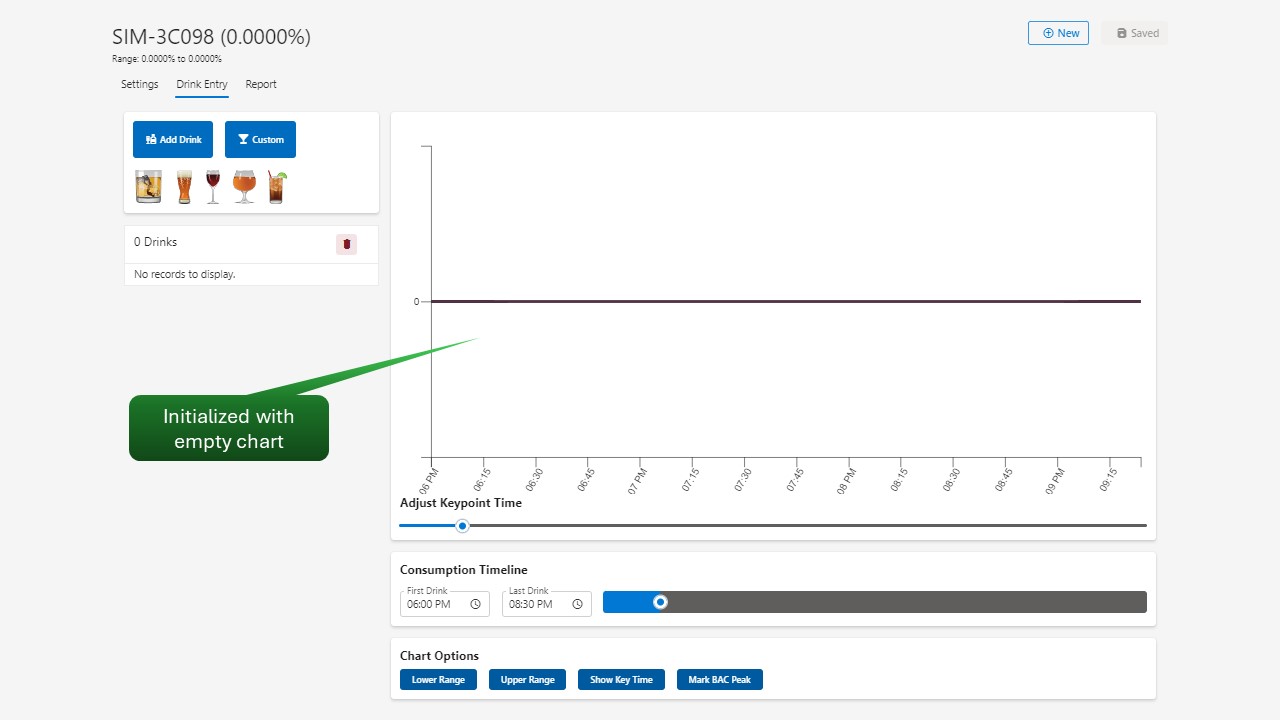
Open drink entry with an empty chart
Before drink entries are added, the chart area is ready for the timeline and BAC range that will be built from the selected drinks.
Drink entry
Build the drinking pattern
Add database drinks, custom drinks, partial servings, and start-stop timing so the scenario reflects the drinking history being reviewed.
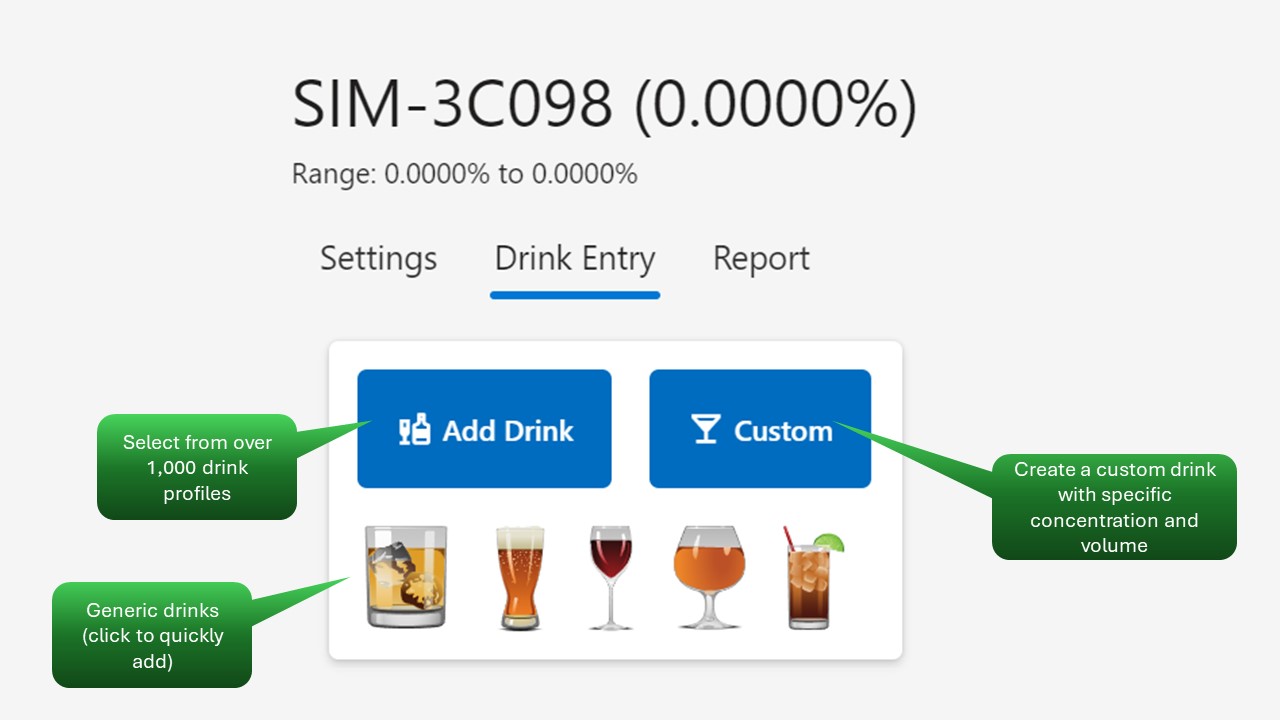
Choose how to add drinks
The drink-entry tools let the user add standard profiles from the database or create a custom drink when the facts require it.
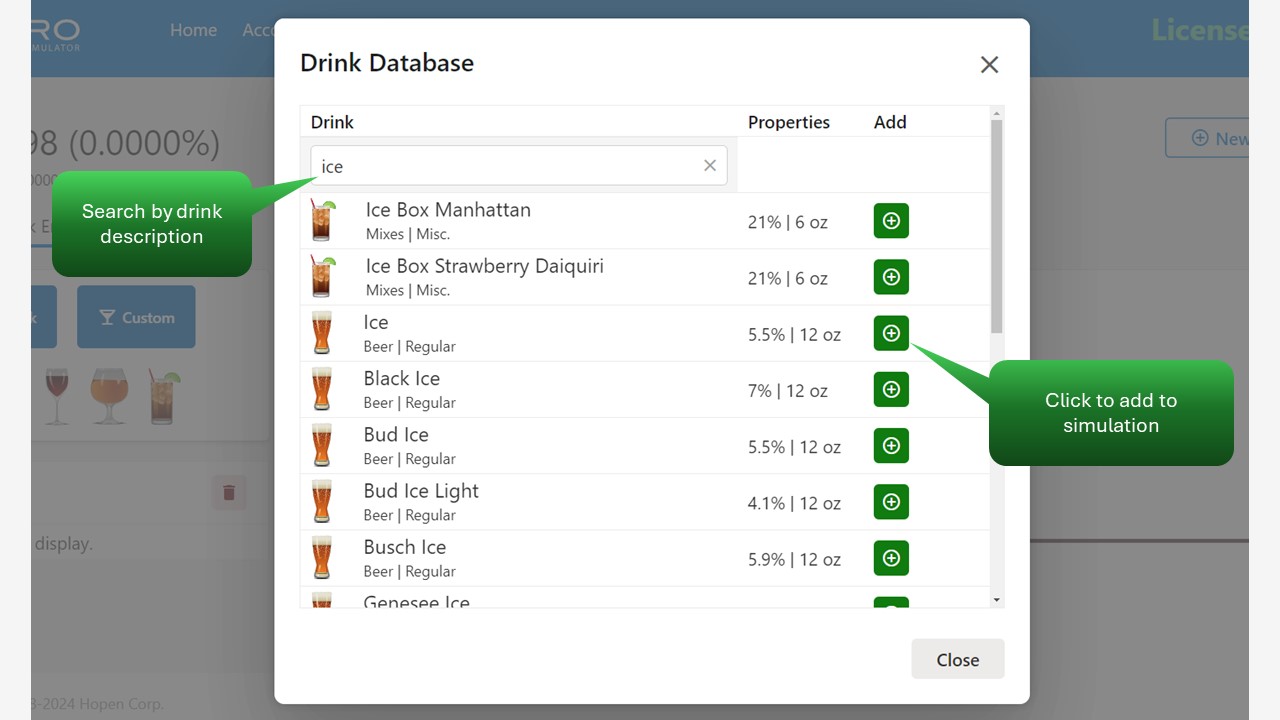
Use the drink database
The drink database provides reference ABV and serving-volume values so common products can be added without rebuilding each profile manually.
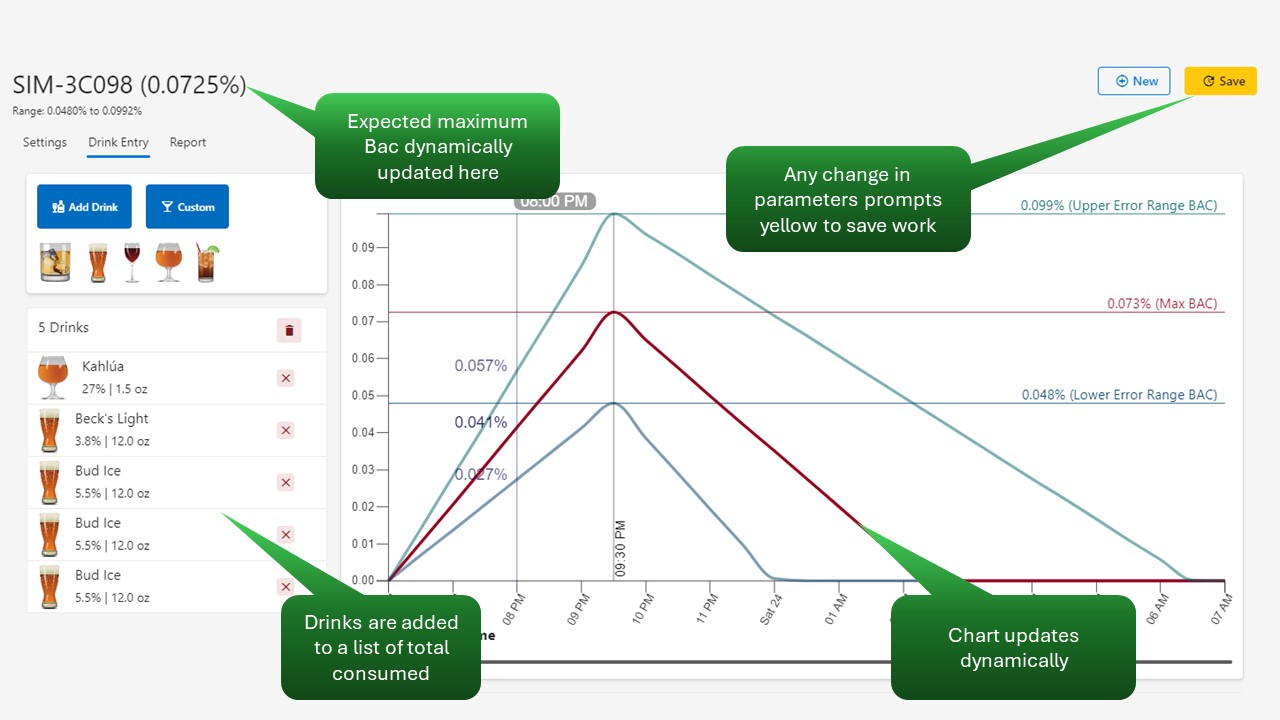
Watch the chart update in real time
As drinks are added, the expected maximum BAC and the charted lower, midrange, and upper curves update dynamically.
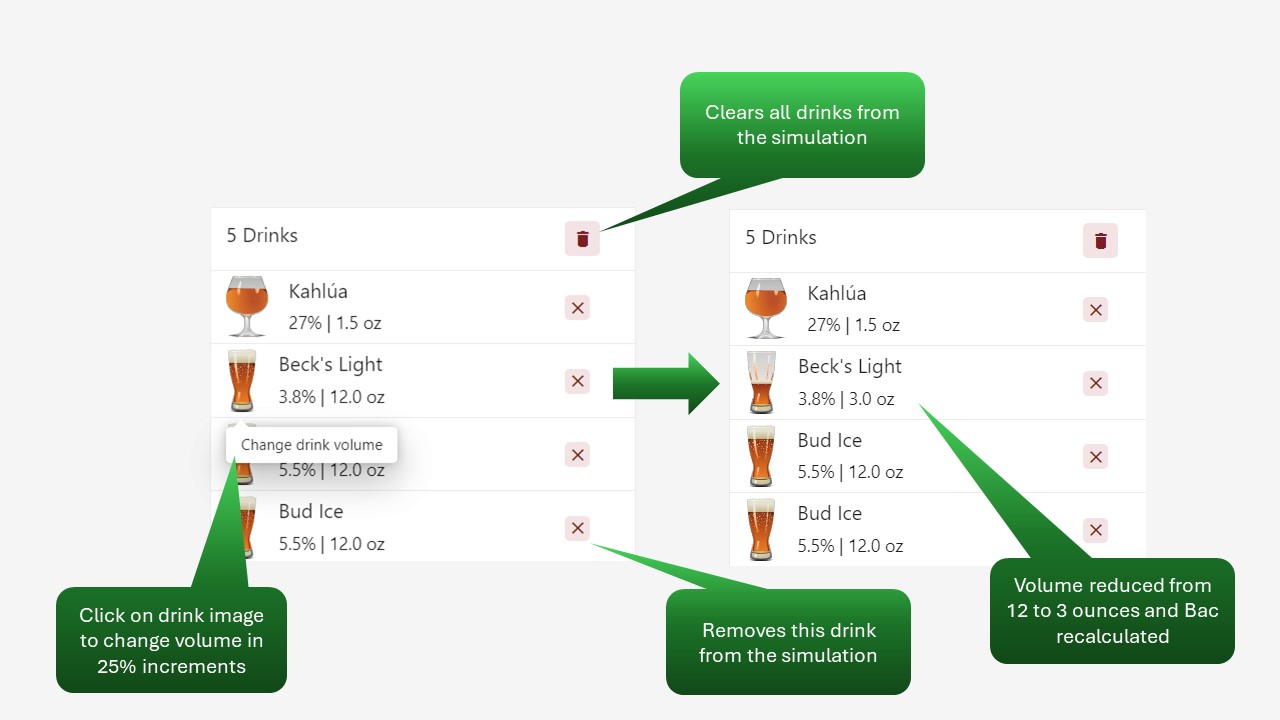
Adjust partial drink volume
Drink volume can be adjusted in practical increments so a partial serving changes the modeled alcohol dose immediately.
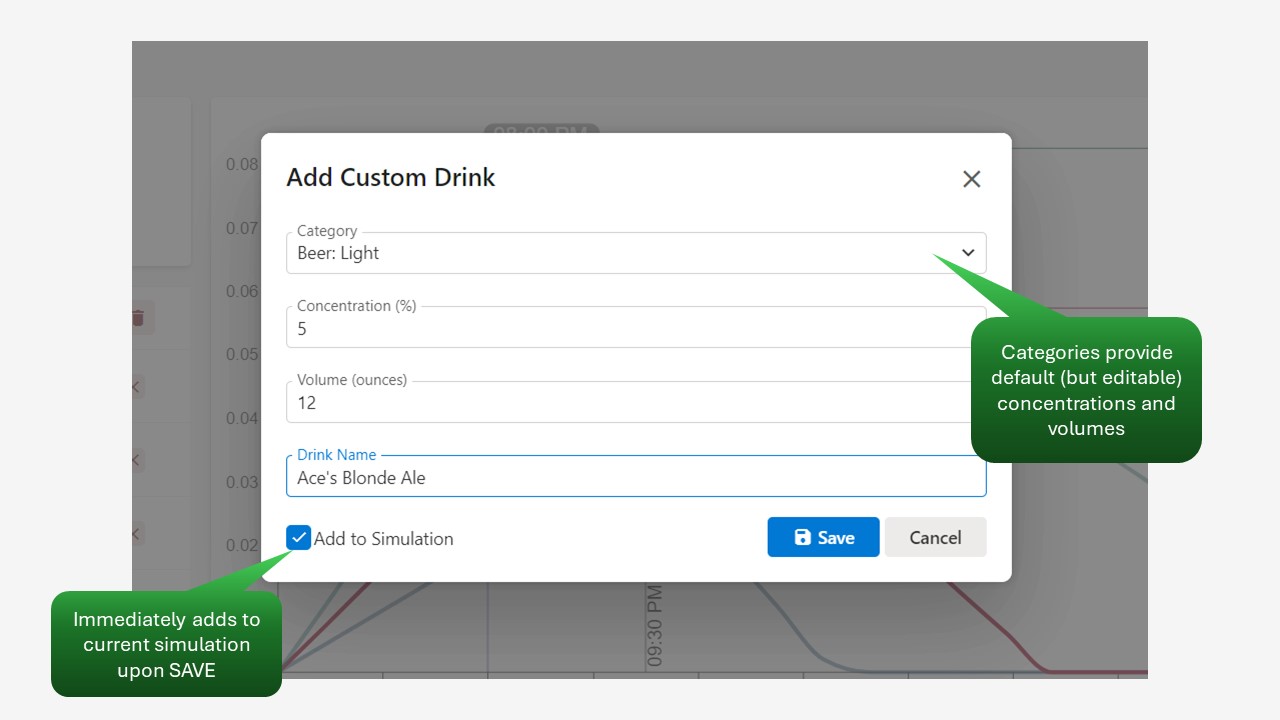
Create a custom drink
Custom drink entry supports case-specific ABV and volume values when a product or serving size is not already represented.
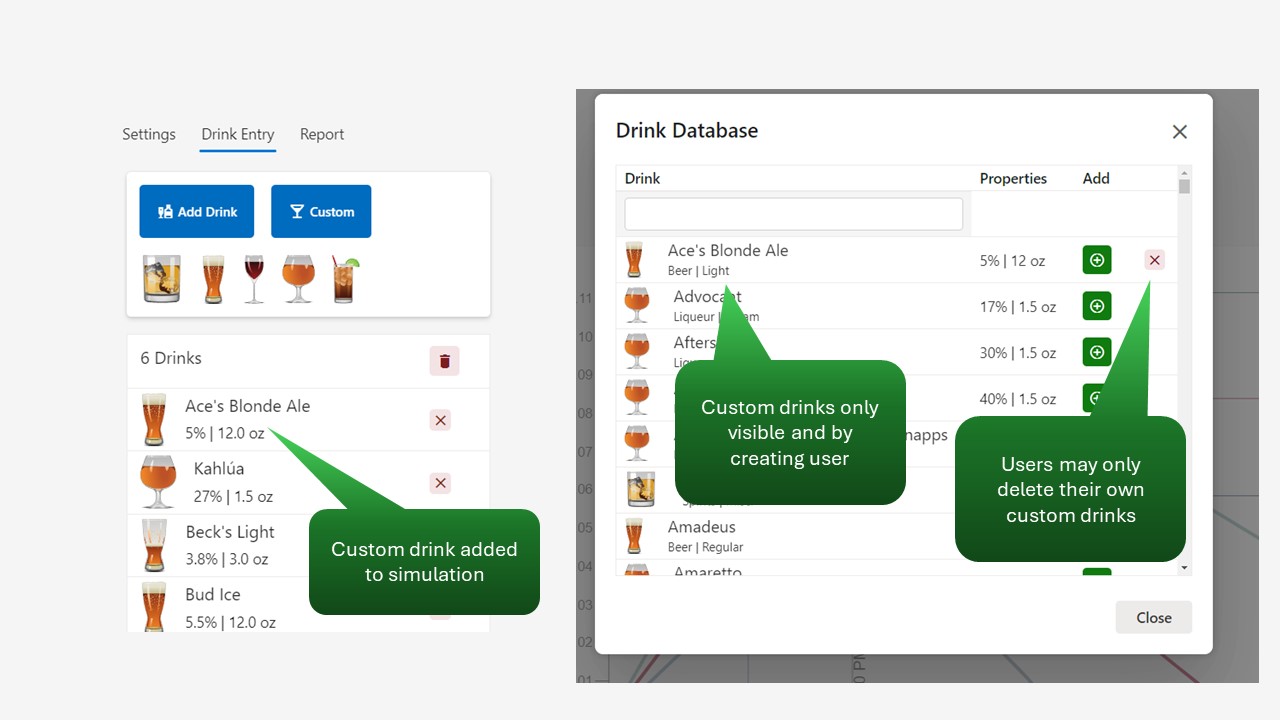
Keep custom drinks user-specific
Custom drinks are tied to the creator so user-specific entries do not automatically change the shared public drink database.
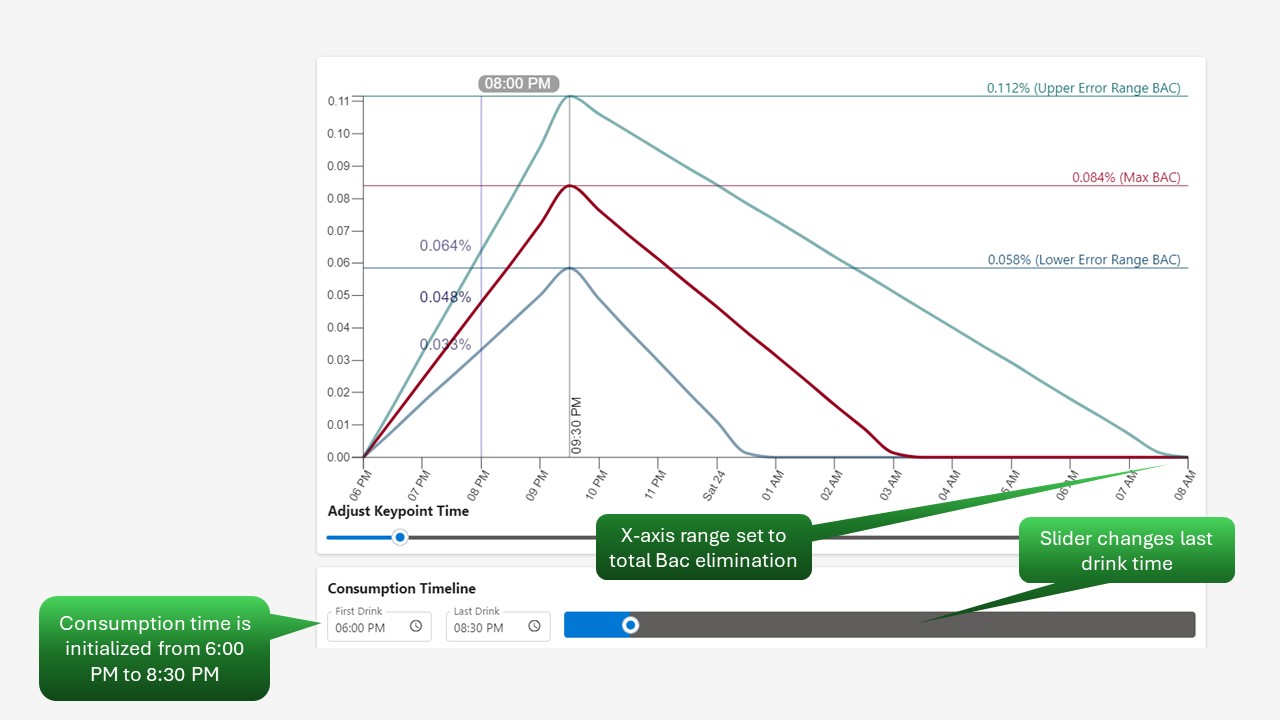
Set drinking start and stop times
Start and stop times define the consumption window that appears on the chart and influences absorption and peak timing.
Chart review
Review keypoint and chart output
Use the keypoint, visible range lines, and chart options to connect the BAC curve to the event time being analyzed.
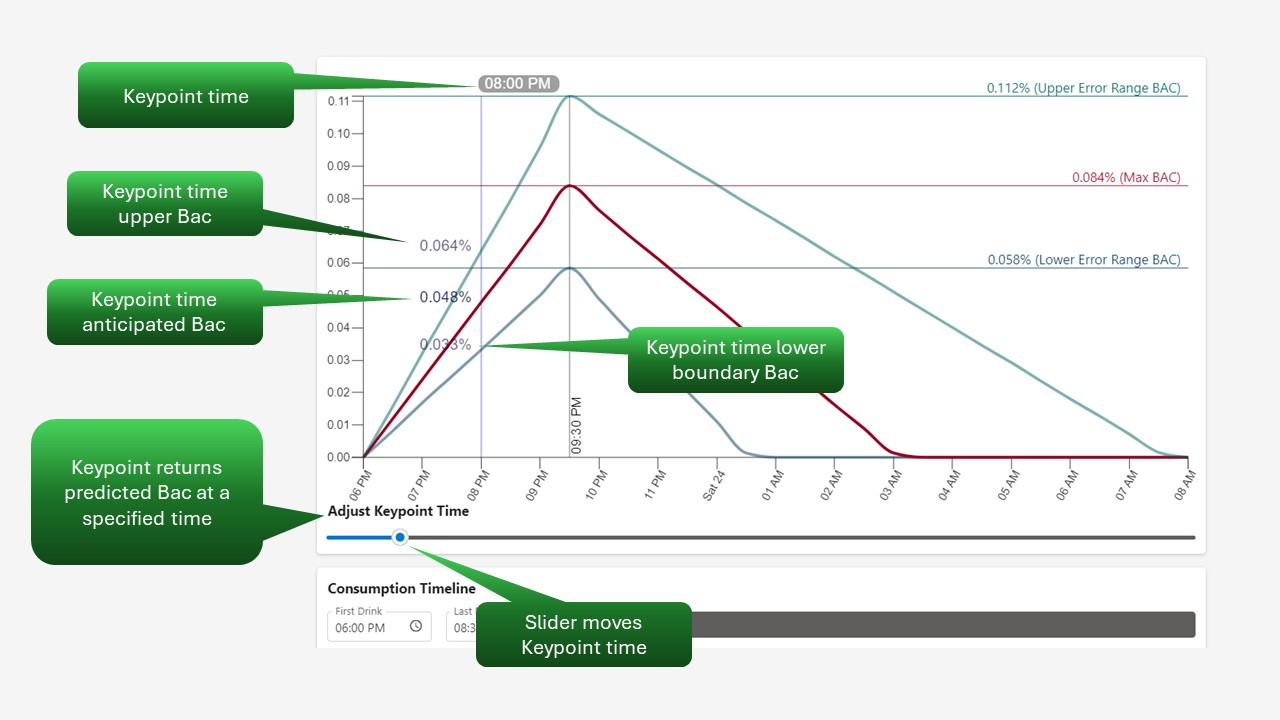
Read keypoint BAC values
The keypoint marker shows modeled BAC values at a selected time such as a stop, incident, test, or safety-critical event.
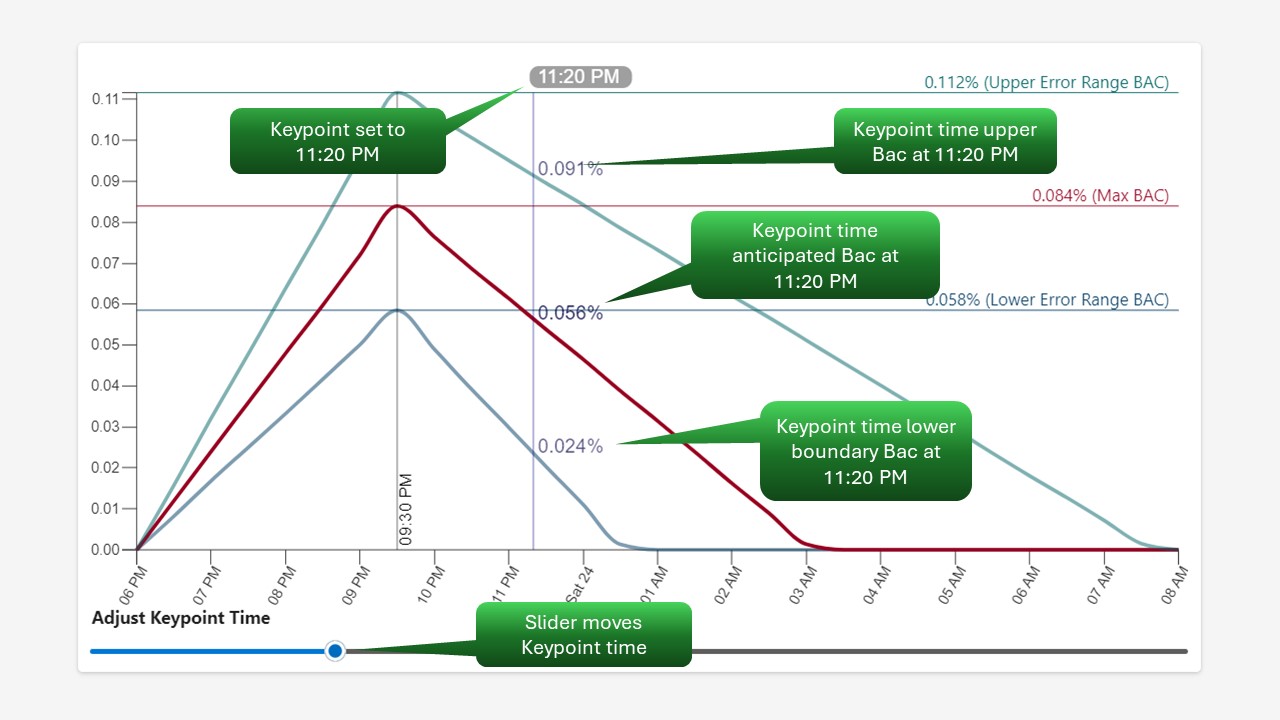
Move the keypoint
Changing the keypoint shifts the event-time marker and updates the BAC values tied to that moment.
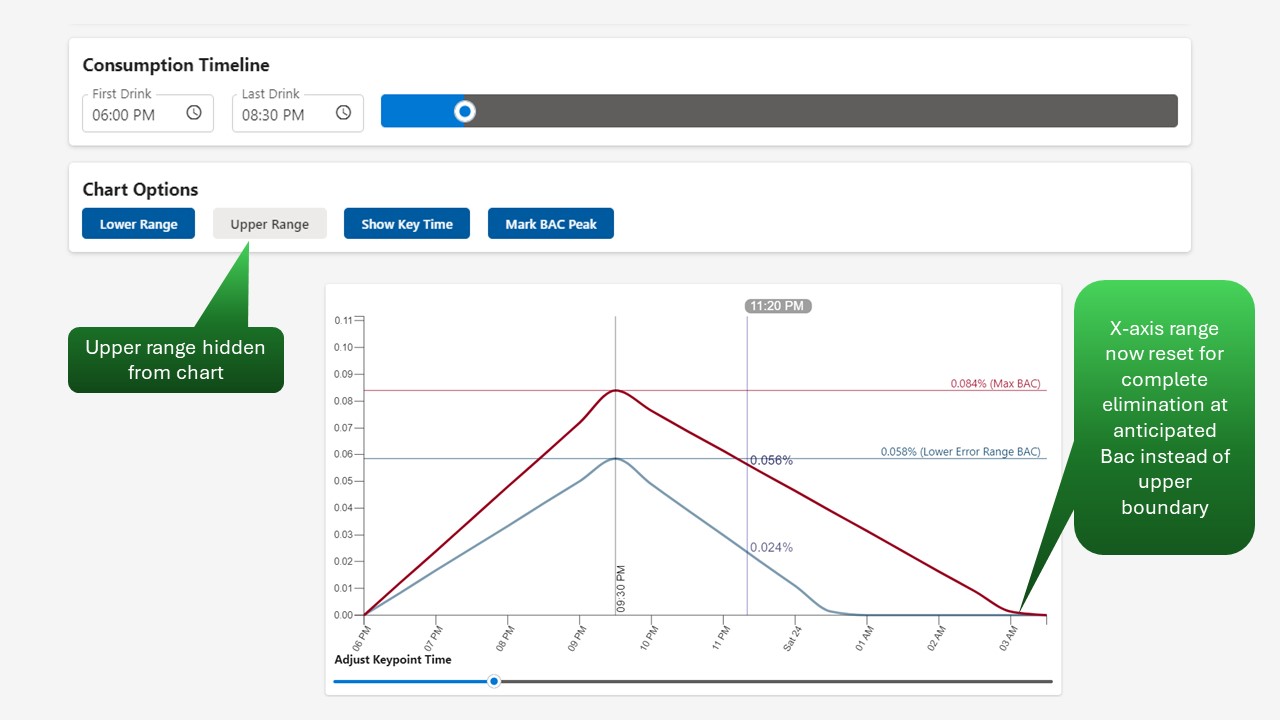
Control chart range visibility
Chart options can show or hide range lines, display the key time, and mark peak BAC depending on the review question.
Reports
Generate reports and preserve the work
Move from interactive review to report output, then save the simulation so the same assumptions can be reopened or revised later.
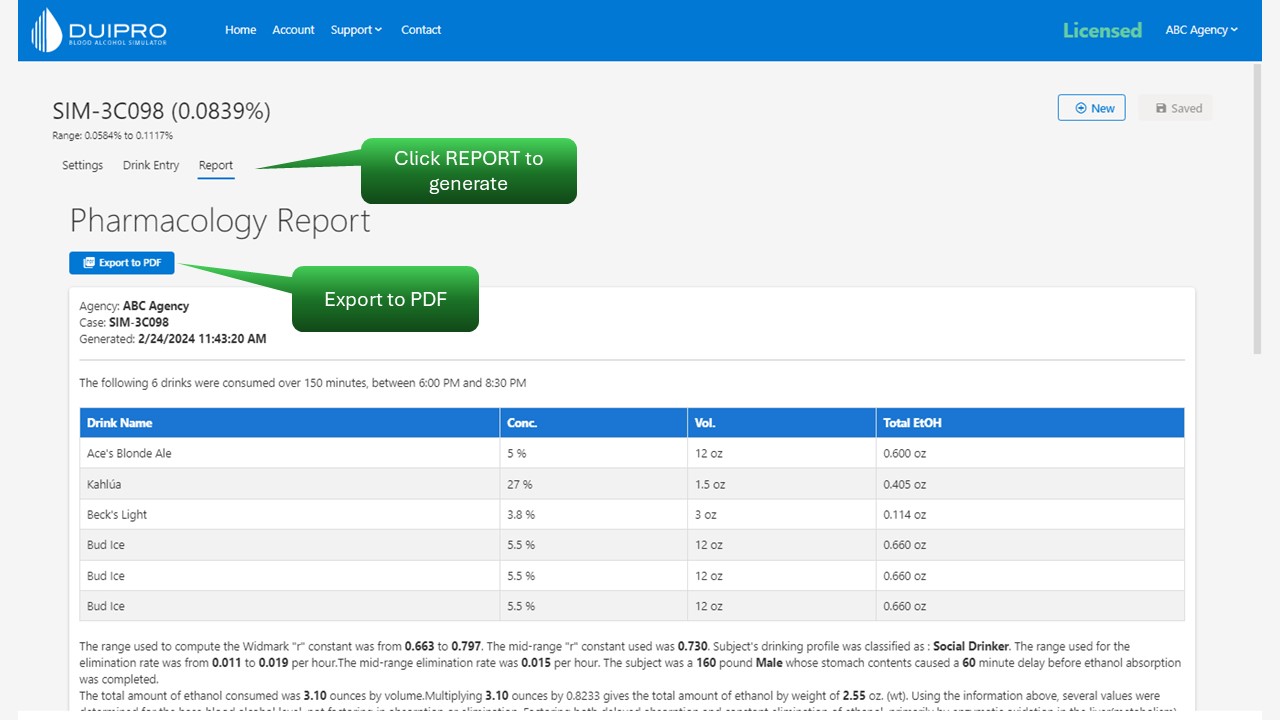
Open the report tab
The report tab gathers the simulation output and starts the PDF generation workflow.
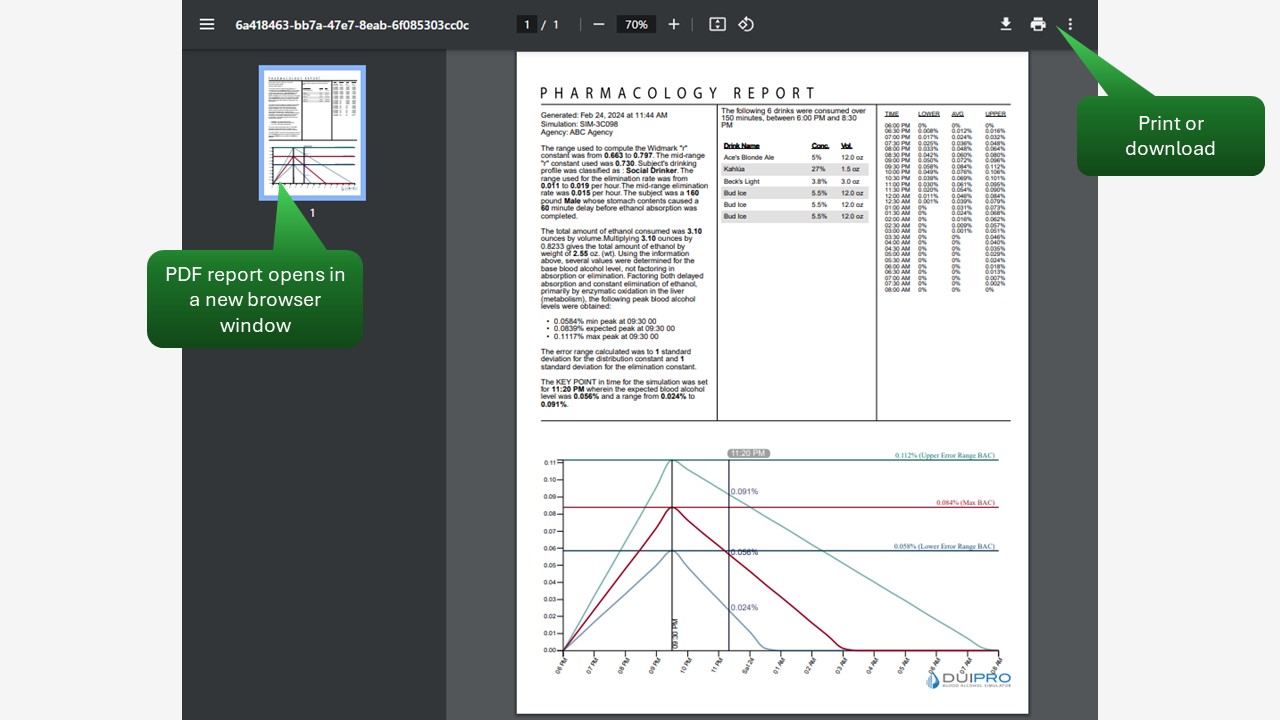
Open the PDF report
Generated PDF reports open for review so the user can inspect output before sharing or saving it.
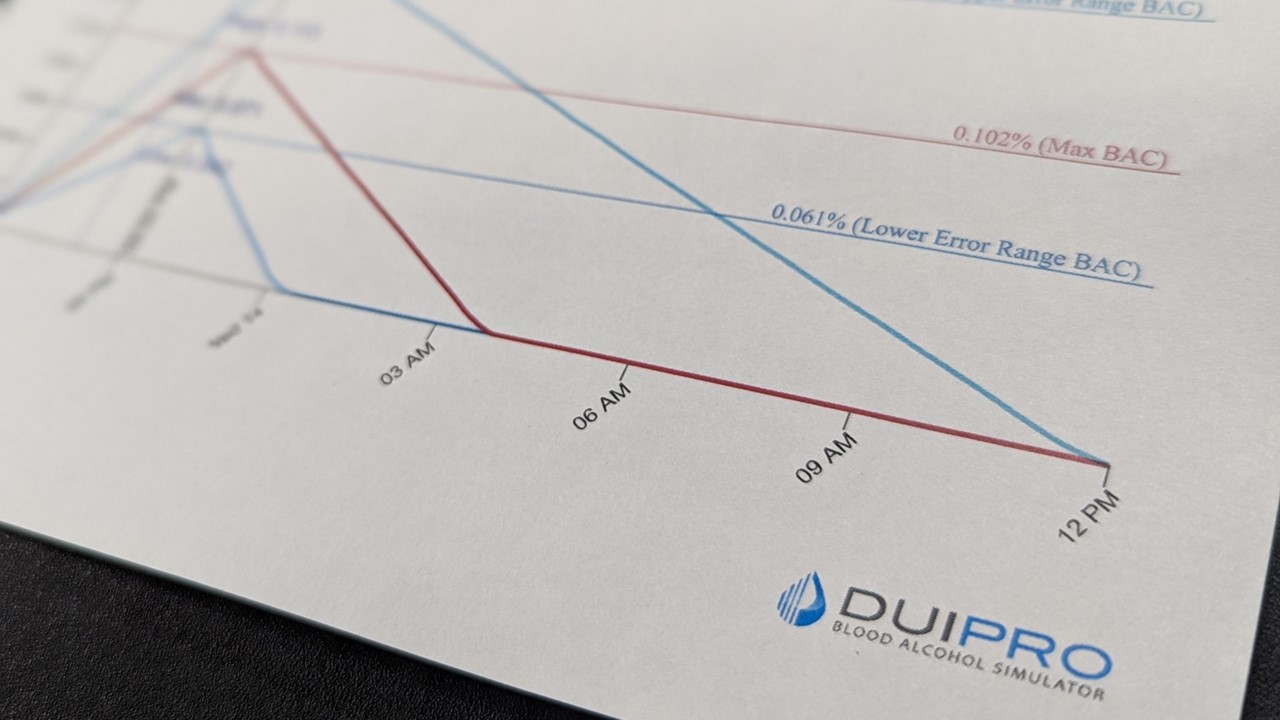
Review vector-quality chart output
The report chart is designed for clean PDF output so graph lines, labels, and values remain readable.
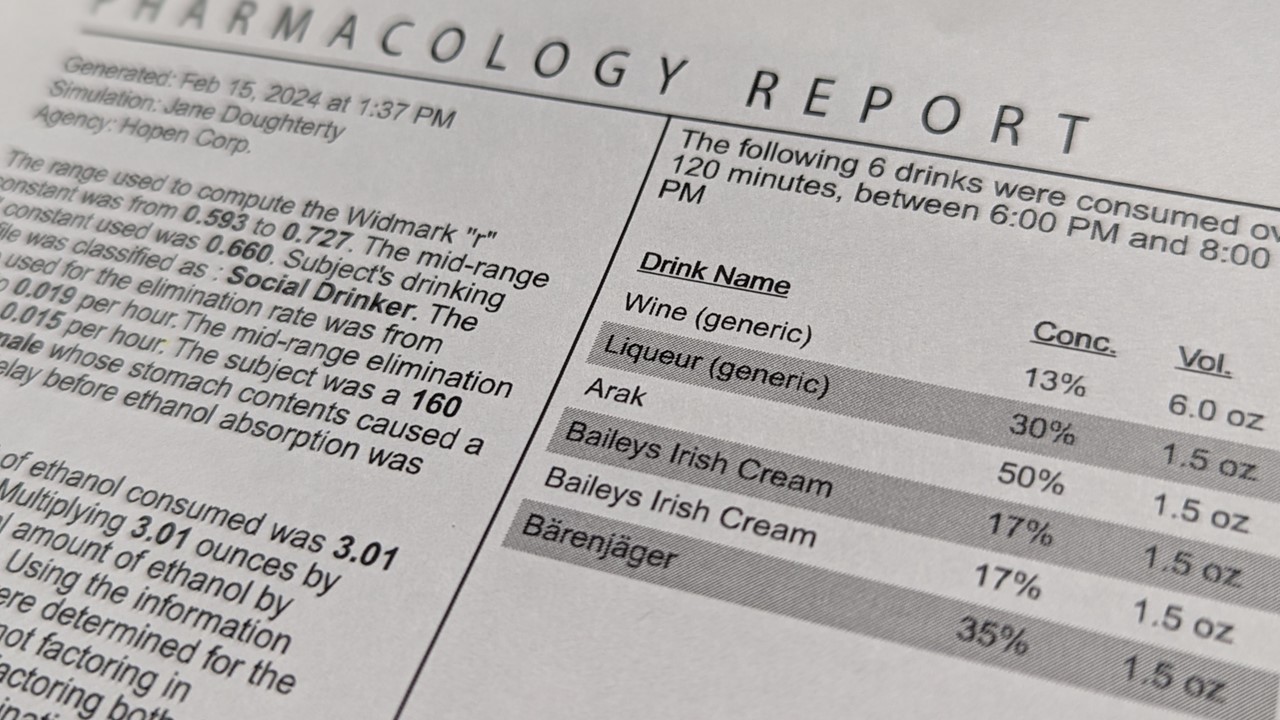
Confirm simulation details in the report
The report carries simulation details such as drinks, timing, BAC ranges, and notes into a durable review artifact.
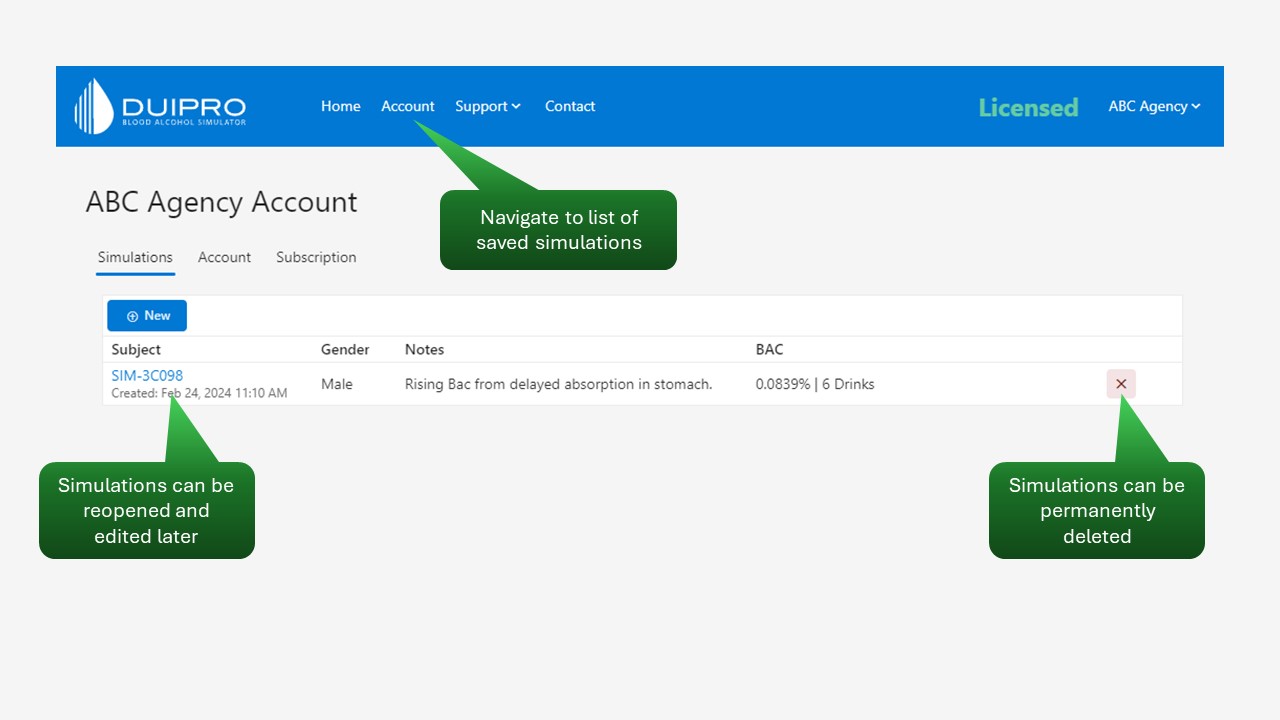
Save simulation settings
Saved simulations preserve the scenario so the user can return to the same assumptions instead of rebuilding the analysis.